
Understanding the issue, when it can come up, and what can be done to account for it
When software bugs are found, notifications are posted in the Known Bugs page, on the MASS welcome screen, as well as here on the CMDC website software blog in an effort to be transparent and keep all MASS users informed. This issue was found within our own office as a result of some unrelated testing on Multi-storey walls in MASS Version 4.0. As a result, the fix will be incorporated into the next software release and in the meantime, must be checked for manually by engineers who may encounter this issue.
This post outlines the conditions required to trigger this error, where the design results could have been affected, the details of the bug itself, and how to check to see if this bug is present in any MASS project.
Jump straight to:
Bug Summary
For shear wall element designs where the web grouting pattern has not been set to “fully grouted” and the flange is fully grouted as a result of vertical reinforcement placed in each cell, the maximum allowable axial load limit is overestimated. The actual envelope curve where axial load is considered to determine moment resistance is plotted correctly and not affected by this bug. As this upper portion of the diagram tends to also correspond to lower factored bending moments, designs with any significant lateral loading would also be unlikely to be affected by this particular item of concern.
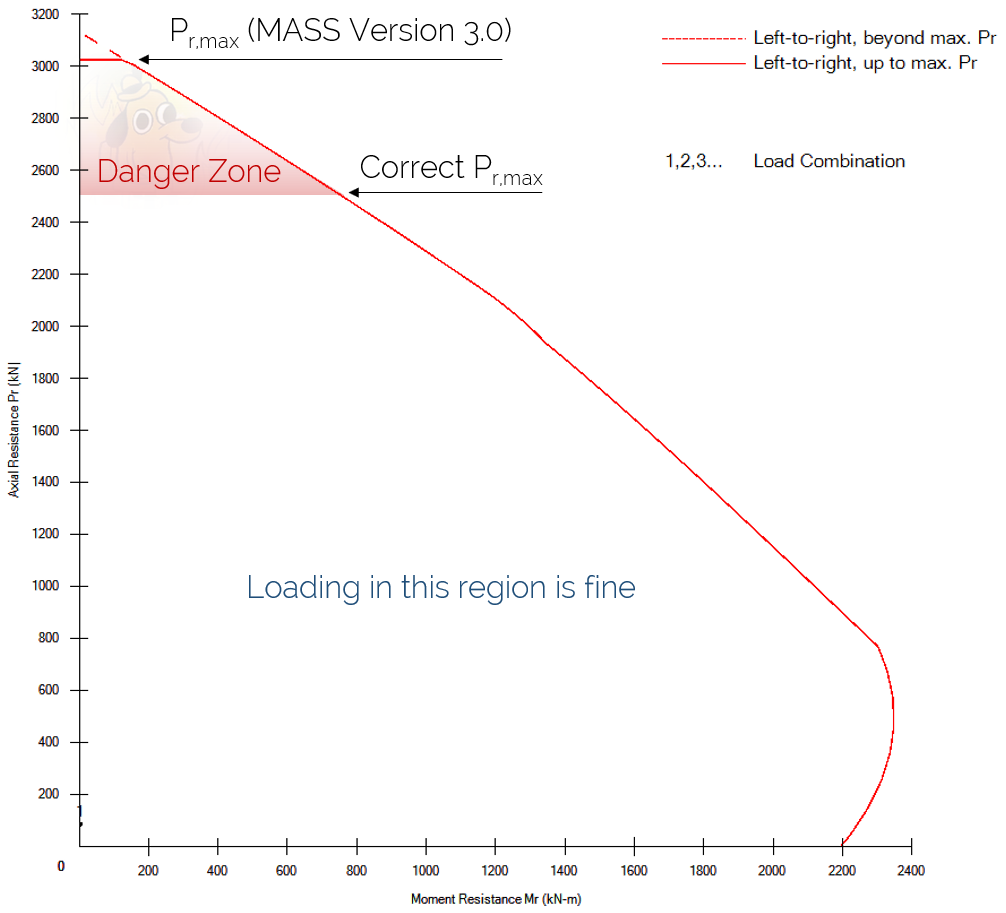
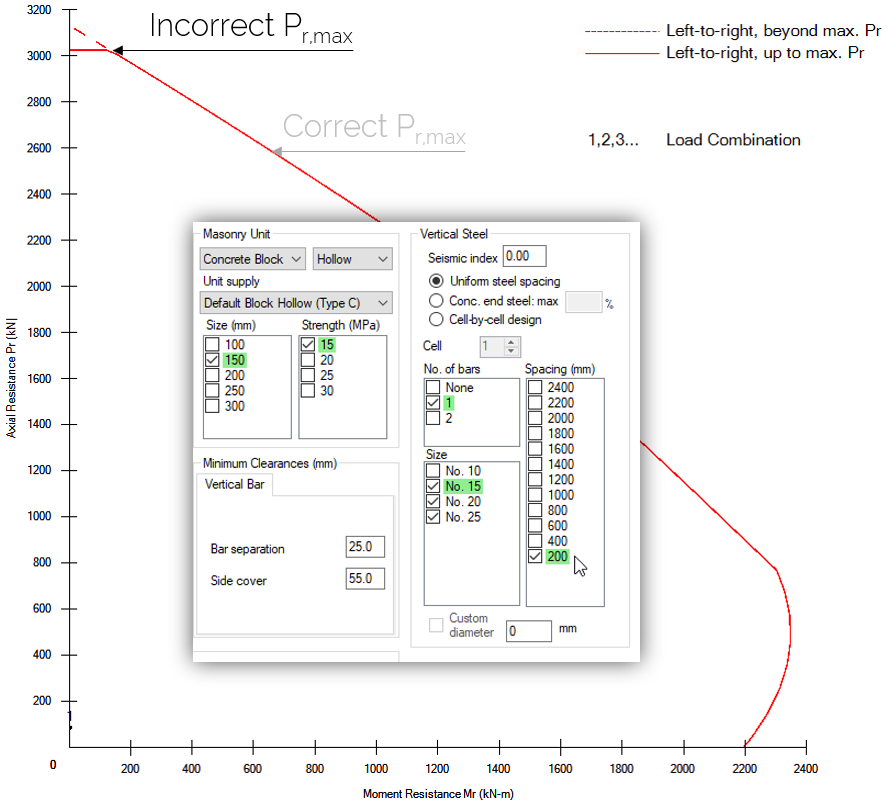
The horizontal line represents the maximum axial load, Pr, and in designs affected by the bug, that line’s location is calculated by MASS to be higher than what it should be.
Since this is only triggered for fully grouted walls with the partial grouted selection, there may be other reasons why a bar is being placed in every cell beyond needing the moment resistance. For more information regarding why MASS may be placing so much steel, click here to open this related article (opens in a new tab).
Background Information
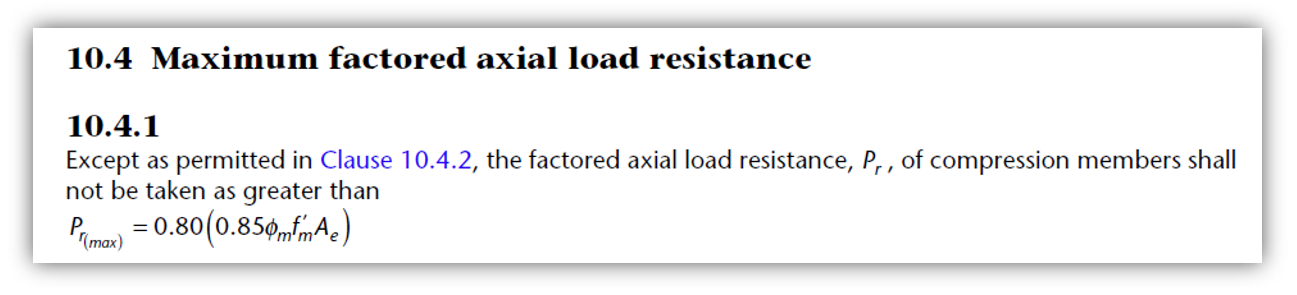
The MASS Software has a dedicated design routine for determining Pr,max. The maximum allowable is specified by CSA S304-14: 10.4.1 is 80% of the axial load corresponding to the assemblage in full compression (where ß1c = lw).
This upper limit is calculated using a dedicated process which uses a particular formula based on whether the wall is hollow, fully grouted, or somewhere in between. This is done individually for the shear wall web and each flange (or boundary element in the upcoming Version 4.0 release) where the total upper limit is equal to the sum of each of the components added up.
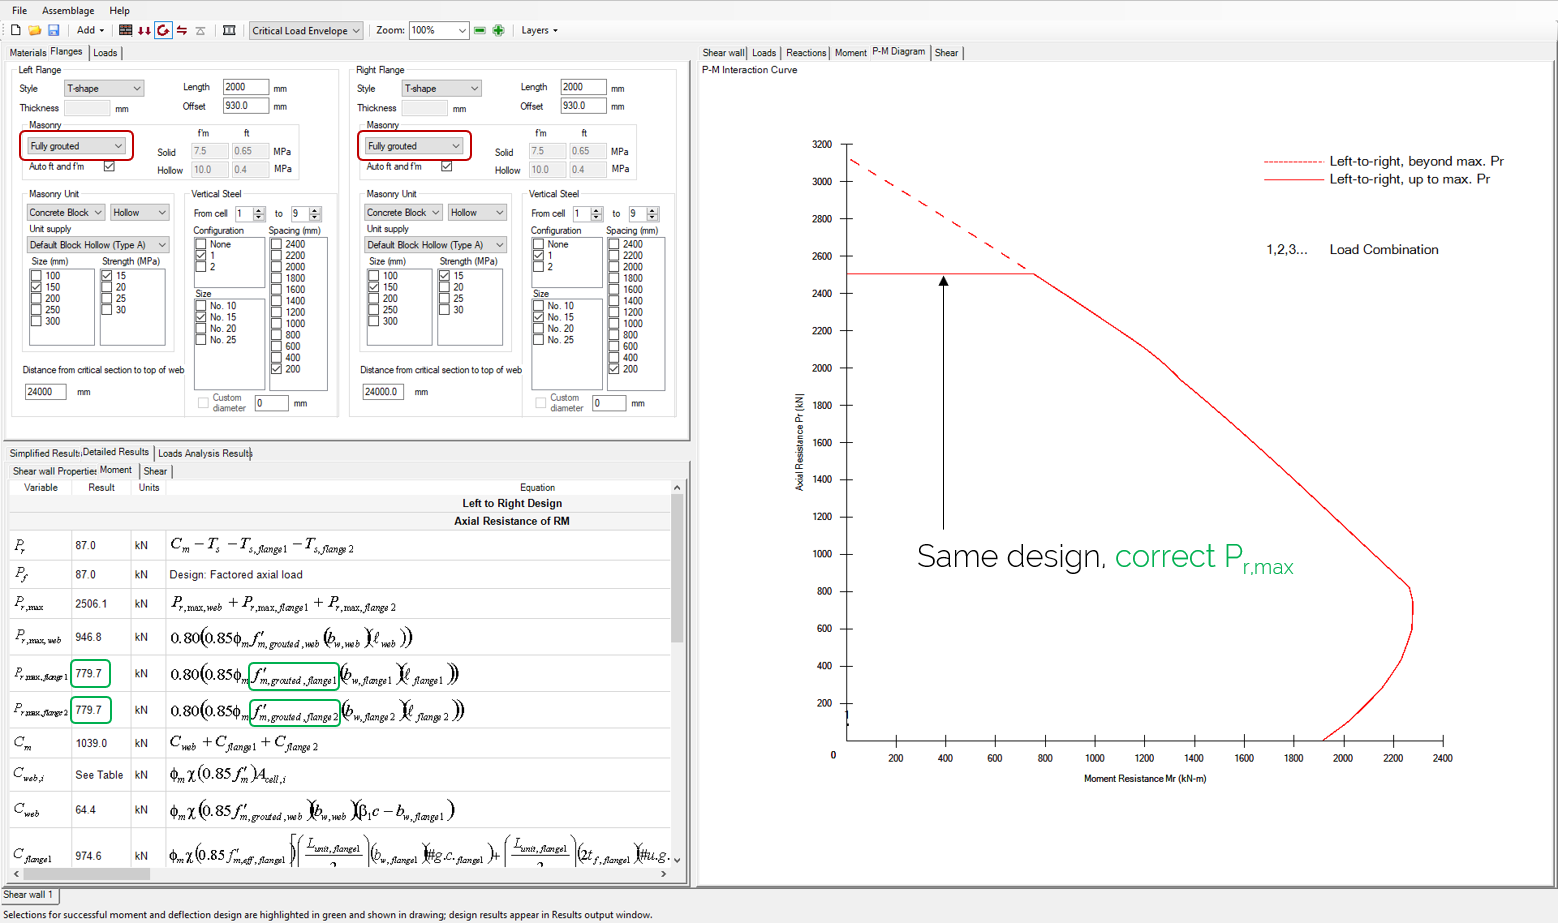
The actual values used in MASS can be found by scrolling down the Detailed Moment Results tab, shown below:
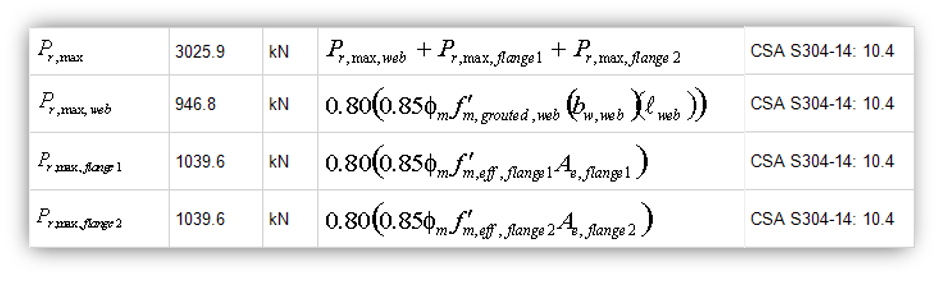
Excerpt from the Results tab showing Pr,max components
The 1039.6 kN value seen in MASS has been incorrectly calculated using the f’m,hollow, flange = 10 PMa instead of the correct f’m,eff,flange = 7.5 MPa.
Once Pr,max has been calculated, it is can be seen on the P-M diagram (also referred to as the interaction diagram) near the top where a horizontal line is plotted. Values capped by Pr,max as well as those which extend further upward are both shown and can be selected by the user to see more exact values of the individual points.
Pro Tip: When a point is selected, the arrow keys can be used to jump to adjacent points along the envelope curve.
The actual values used along the interaction diagram curve are correctly plotted and are unaffected by this bug. This issue is specifically the height at which the upper limit on axial load has been capped.
What types of designs might be affected?
In order to have a design result that was declared by MASS to be successful when it should not have been, there are two conditions that would have to occur:
Condition 1: The cross section and input selections would need to trigger the bug in the Pr,max calculation.
This means that shear wall flanges with the “partially grouted” selection applied with bars placed in each cell as a result of other user input values are the only types of designs that can have the incorrect Pr,max value calculated. If any one of these conditions is not met, the correct maximum axial load is calculated and even for affected cross sections where the bug is present, the plotted P-M Diagram envelope is still correct, with the exception of the height at which it is capped. Click here to jump to a full description of how to verify this condition
Condition 2: The loading needs to result in an axial factored load that exceeds what would have been the correct Pr,max value.
Load combinations with relatively low factored moments coupled with high axial loads may lie between Pr,max shown in MASS and the correct value. Click here to jump to the full description of how this can be checked in any MASS project file.
Each of these conditions is elaborated upon in the subsequent sections below. If unsure whether a previous design performed in MASS has been affected, MASS technical support is available to manually check the detailed results and confirm whether or not this bug is present in any project file.
How to tell if a design has been affected
Often times, this bug can be seen at a glance by viewing the P-M Diagram for any design. If the horizontal line drawn at Pr,max does not appear to be roughly 80% between the origin and the location where the envelope meets the vertical axis, this project file may be affected. This check is broken down into two conditions, both of which must be satisfied for a design’s results to have been impacted by this bug.
Any use of the software results for design, as well as checks, calculations, and verification described in this section and elsewhere is done at the sole discretion of the user using their own professional judgment. If you have any questions and are not 100% confident in your understanding of the material, please contact MASS support for further assistance.
Manually checking Pr,max (Condition 1)
Confirming whether this bug is present in any MASS project file is a fairly simple procedure. The most thorough approach is to manually calculate the flange contribution to Pr,max seen in the Detailed Moment Results (see example further below for demonstration), however, this can also be done by viewing the P-M Diagram drawing and locating the point of pure compression along the outer envelope curve.
Note: For shear wall designs with flanges, this will correspond to a neutral axis location of the total wall length (including flange thicknesses) divided by 0.8. Also known as the highest point with a corresponding moment resistance of zero.
Visual Inspection Method
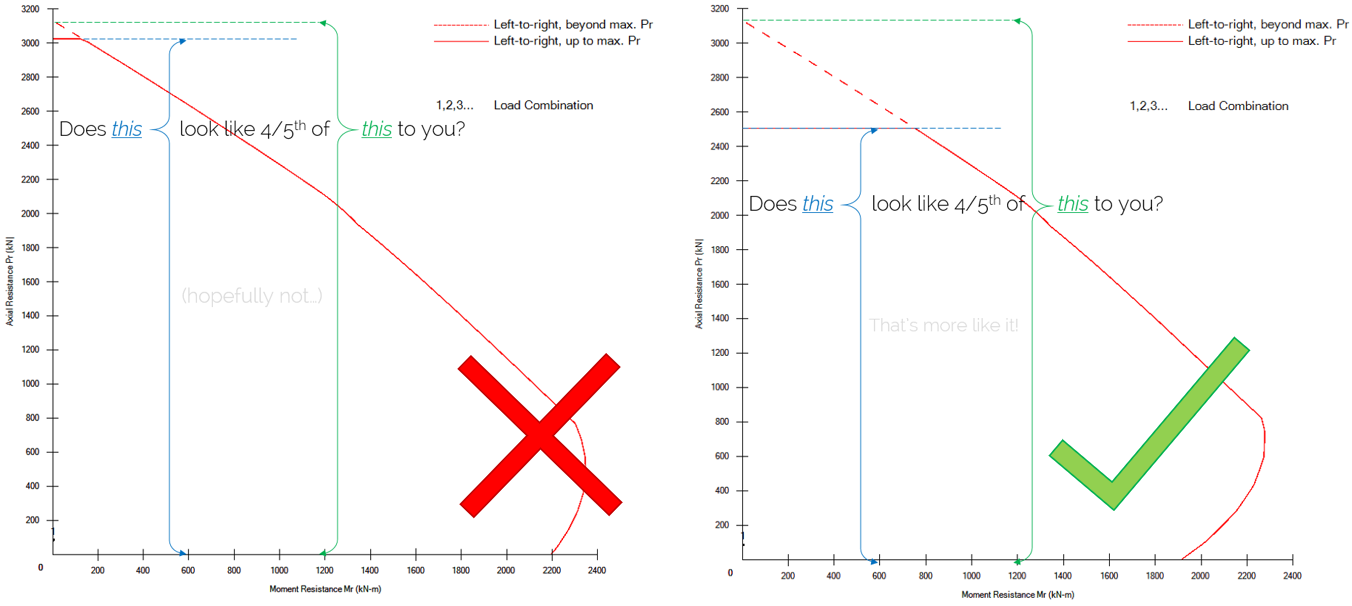
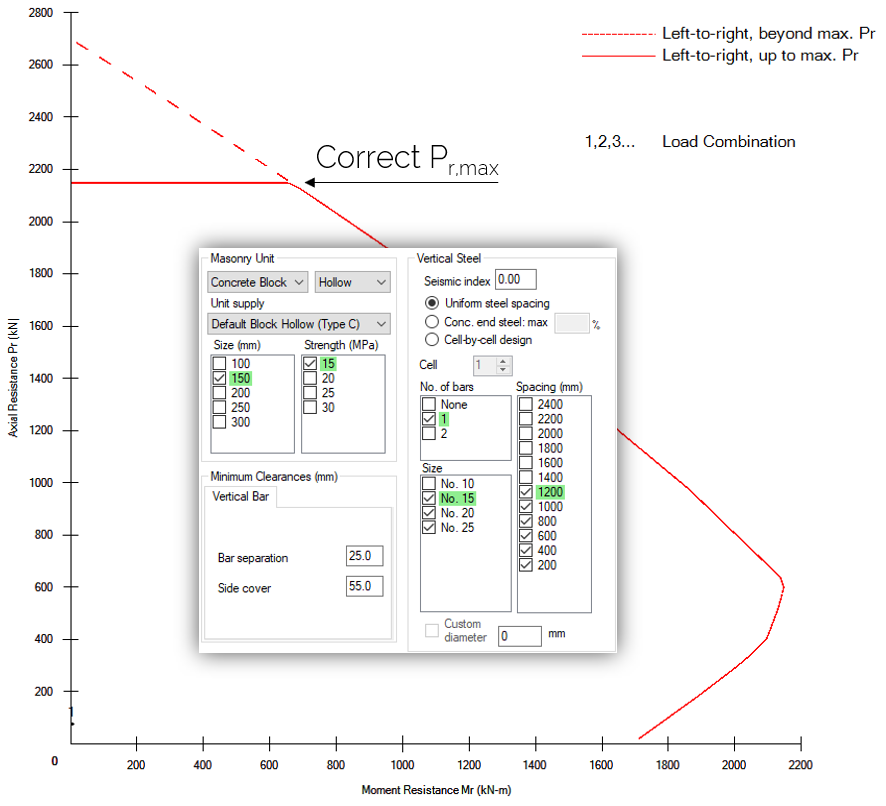
In many cases, this issue can be identified by simply eyeballing the general height of the Pr,max limit and comparing it to where roughly 80% or 4/5ths of the height should be capped for the design. The figure below shows an example P-M diagram on the left where the bug is present and from visual inspection alone is clearly not capped at the correct height. The corresponding diagram for the same cross section is shown on the right with the flange grouting pattern changed from “Partially grouted” to “Fully grouted” and as a result, the bug is no longer present and it can be seen that the maximum axial load is capped at the correct height.
Another option is to click on the very top point on the diagram which lies on the Pf axis and multiple that by 0.80. This is less exact than verifying the calculation using the correct inputs (described further below) but can still get a result accurate to within 20kN which will be acceptable for the majority of cases.
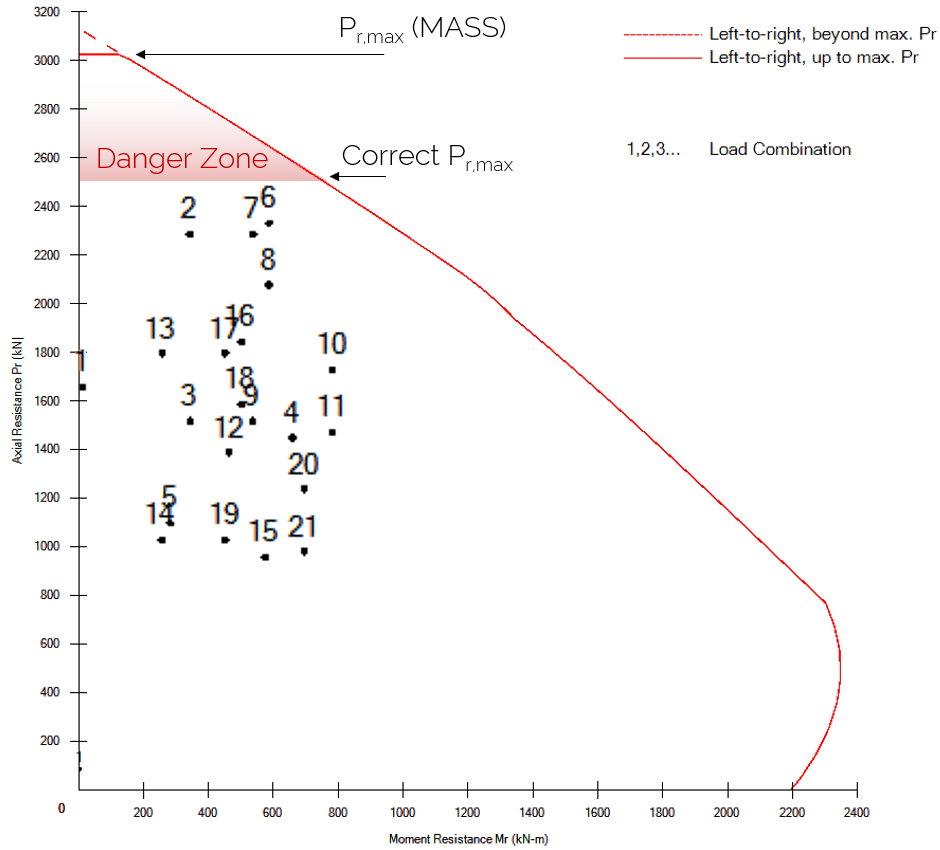
Extreme cases like this are relatively easy to spot with a quick glance of the P-M Diagram. The example used in this article is outlined further below, here, and was purposely done using very long flanges and low masonry unit strength to highlight this issue. It is possible that this difference is less pronounced and is less obvious.
That being said, just because the bug is present in a project file does not necessarily mean that there are any issues with the design results.
Checking Load Combination Locations on the P-M Diagram (Condition 2)
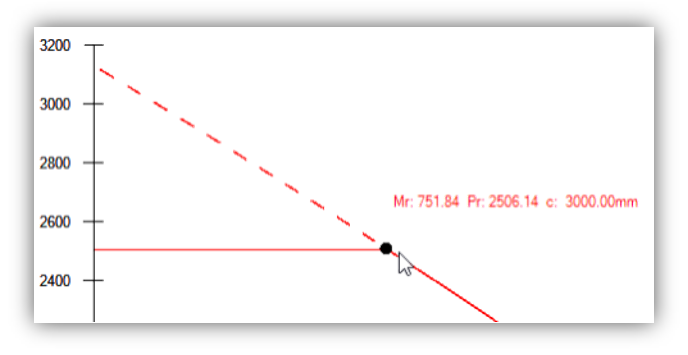
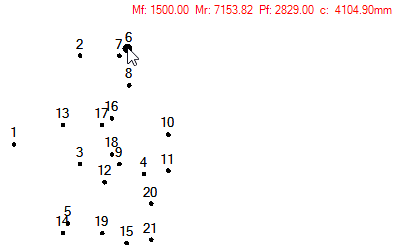
If there is an issue with the incorrect Pr,max value being used, simply check the P-M Diagram and click on the load combinations with the highest factored axial load, Pf.
Any load combination can be selected in MASS by clicking on the point to reveal the exact factored moment, moment resistance, factored axial load, and neutral axis location.
The factored axial load, or Pf , can be compared to the correct Pr,max value to ensure that even if a shear wall’s envelope has not been capped at the correct location, it is still within the acceptable range.
Quick Calculation Check by Hand
If loads are in the upper region of the diagram and the Pr,max line appears roughly in the correct location, it is a good idea to quickly check the numbers by hand. This situation is covered in the section below. In the Detailed Moment Results section of the software where the Pr,max equations and formulas are found, the results can be quickly verified make sure they are correct.
Note: the f’m value used in the Pr,max calculation can be found in the Detailed Shear Wall Properties section of the results window, along with all of the other inputs.
If any value of Pf exceeds Pr,max that was calculated manually in the subsection above, MASS has incorrectly passed these designs when they should have failed. If unsure, please do not hesitate to contact MASS support.
Example Design
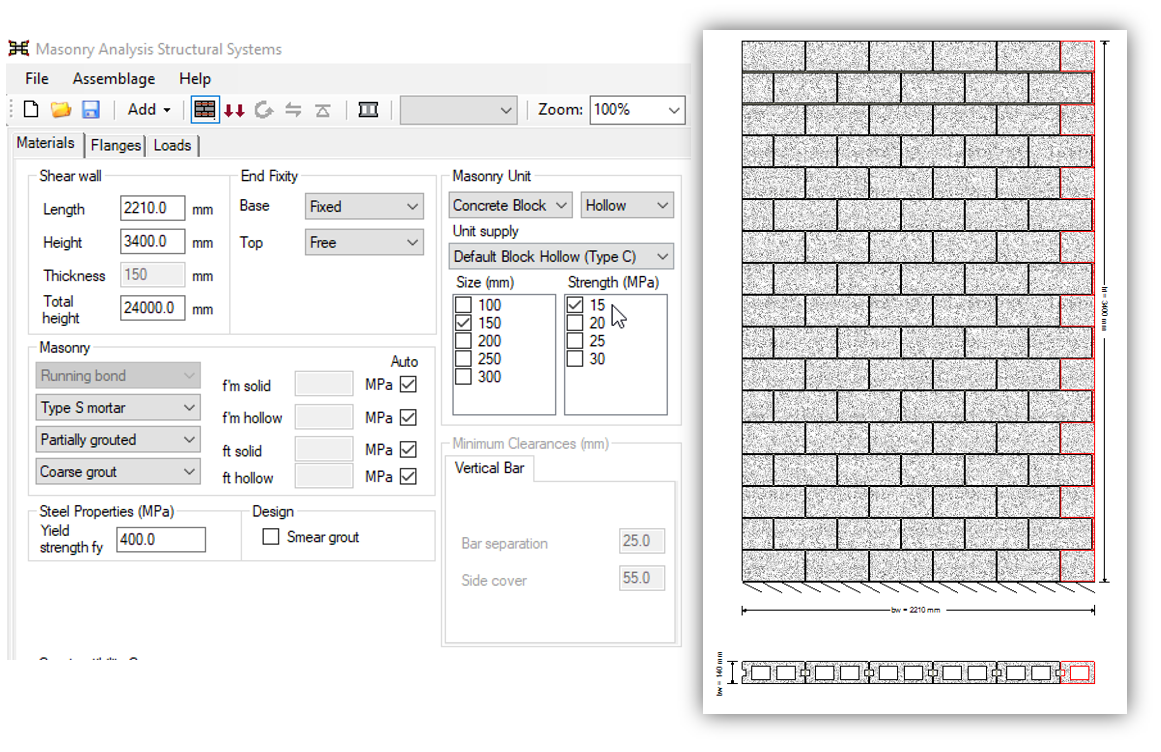
To illustrate this example, a test case was chosen with many aspects that amplify this error. Consider a basic shear wall design where the web is 2210 mm long (2190 mm plus a 10 mm mortar joint on each end) with a height of 3400 mm and a total height of 24,000 mm. Disable masonry unit selections until only the 15 cm, 15 MPa unit are remaining.
Note: for typical design work, it is generally recommended to first leave several options selected before seeing an initial result and narrowing down the design from there. For purposes of demonstrating this bug, this example involves an already known cross section which is the reason for the other options being disabled.
Once the web design has been specified, click on the flange input tab and add a 2000 mm long flange to each end of the wall. Using the default offset value, specify the distance from the critical section to the top of the web as the total height value used earlier: 24,000 mm. This is a commonly missed step which will ensure that a portion of each flange is included in the cross section used for design. If this value were left at the default 0 mm, only the portions of the flanges directly adjacent to the web (140 mm in this case) would actually be used.
Once the flanges have been specified, click on the loads button and enter basically anything. In this example, a 1kN lateral dead load is applied simply to allow the MASS software to advance to the moment design stage. Since this bug relates to the envelope curve, exact loading is irrelevant as it only impacts where the load combination points will be drawn on the diagram.
For more detailed instructions on how to reproduce this bug, click here to expand
To hide this expanded section, please click the heading again.
Creating the Web and Overall Height Geometry
Create a new shear wall element and enter the following dimensions:
Length: 2210 mm (2190 mm web plus a 10 mm mortar joint between the eventual flanges)
Height: 3400 mm
Total Height: 24000 mm
De-select all size and strength options other than the 15 cm, 15 MPa masonry unit
Creating the Flanges
Move to the Flanges input tab and create the following flange on each side of the shear wall:
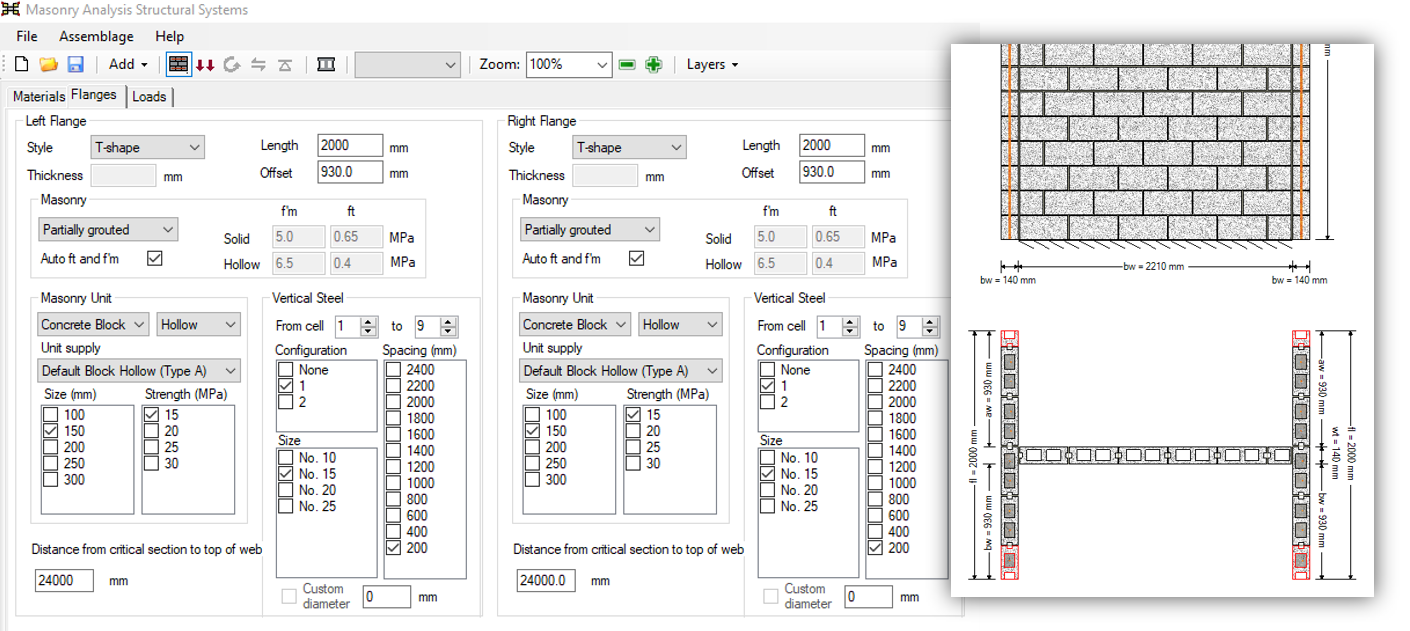
Style: T-Shape (overhangs on each side of the web
Length: 2000 mm
Offset: 930 mm (default MASS value with equal overhang in each direction)
De-select all size and strength options other than the 15 cm, 15 MPa masonry unit.
De-select all size and spacing options for vertical bars other than a single 15M bar placed in each cell (200 mm spacing).
Repeat this for the right flange after completing the left
Note: Don’t forget to specify the “distance from critical section to the top of web” which in this case is the total height (24,000 mm) if we are looking at the bottom storey
Adding the Loads
For the purposes of demonstrating this bug, any nominal loading can be applied. Recall that the PM Diagram envelope curve is a function of shear wall cross section and independent of loading.
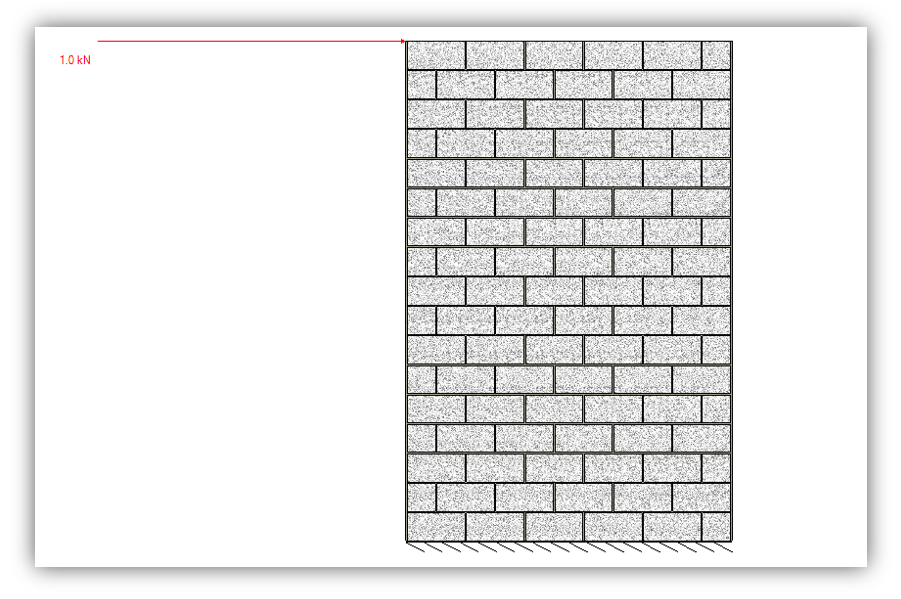
A 1 kN lateral Dead load is applied for the purposes of progressing to the moment design stage.
Upon running a moment design, there should be successful results displayed with a fairly large spacing of vertical bars. Click on the PM Diagram drawing and note the location of the Pr,max line where axial load is capped.
So far in this example, the bug has not yet presented itself. Proceed by disabling all of the spacings except for 200mm, placing a vertical bar in every cell. It is these designs where you may notice a dramatic shift in Pr,max.
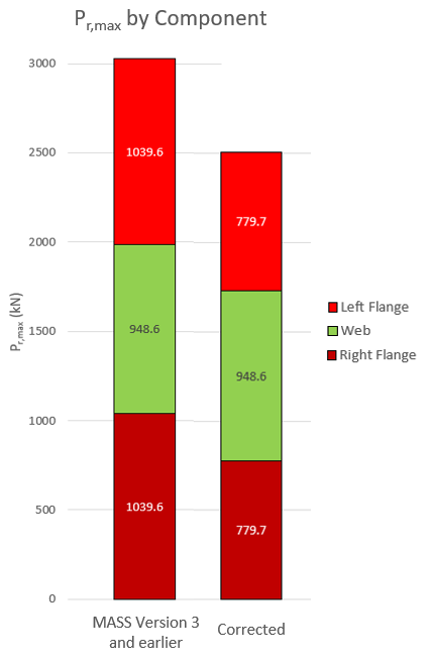
Breaking down the calculation of Pr,max, it is made up of three components: the left flange, the web, and the right flange. Selecting the Detailed Moment Results tab, these values can be seen in the results screen, as well as below:
Manually checking these flange values based on the inputs seen, the following is the expected (and correct) value:
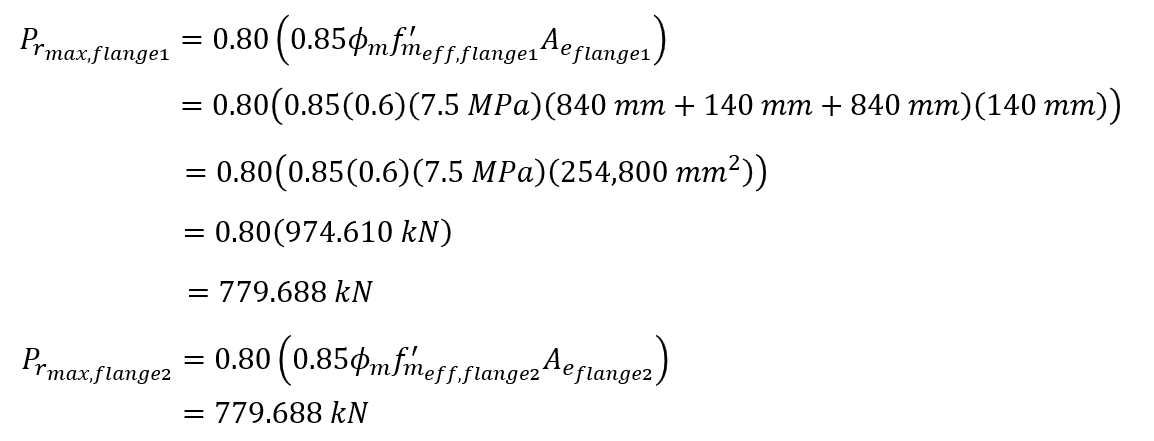
Referring back to the bug summary, this issue presents itself when a shear wall web becomes fully grouted due to a vertical bar placed in every cell at 200mm spacing. The f’m value used for the flanges is incorrect, referencing the hollow value of 10Mpa instead of the grouted 7.5MPa from Table 4.
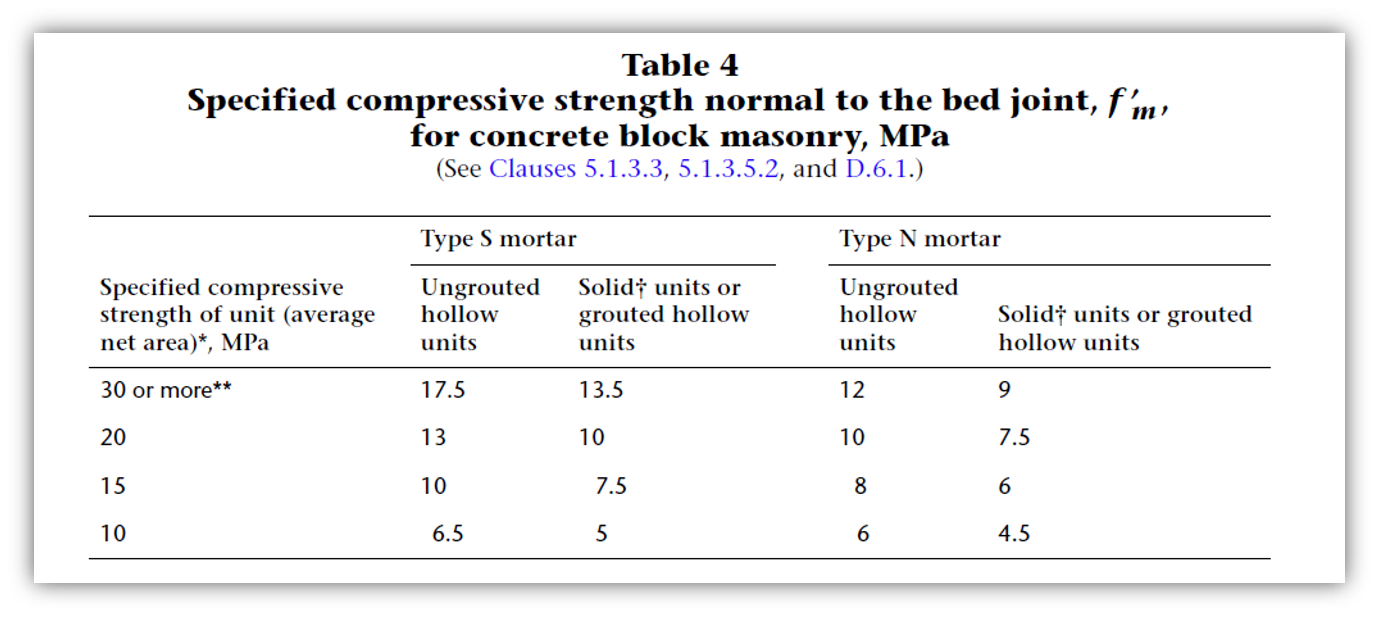
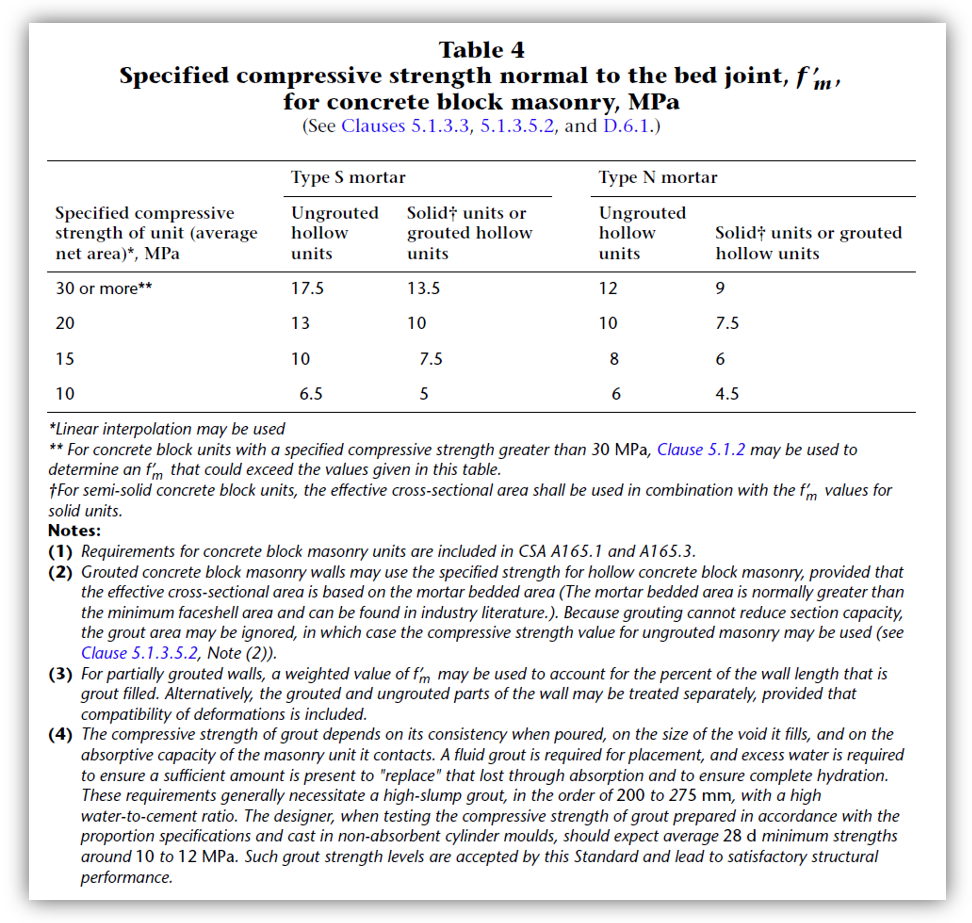
To see the full table including notes, click here to expand
The heading can be clicked again to hide the full table.
As mentioned at the start of this subsection, the example chosen for this demonstration exercise for a few reasons. The first is that a small, low strength masonry unit was chosen because in percentage terms, there is a very large jump (33%) going from the grouted to hollow strength which diminished for higher block strengths. Shear walls with long effective flanges in relation to the web size also experience a higher discrepancy in Pr,max because the flange terms make up a higher portion of the total maximum load.
Click to expand additional shear wall bug notes (optional reading)
Click the heading again to hide this subsection.
To further demonstrate how finicky it is to trigger this bug, the image below shows a screenshot where the exact same shear wall is being designed. The difference is that instead of the flanges being “partially grouted” with a bar in each cell effectively resulting in a fully grouted wall, the grouting pattern has been changed to “fully grouted” and the correct Pr,max value is used (seen in the PM Diagram below):
The difference from the perspective of the software’s code is that a different equation object is referenced, using the f’m value corresponding to a fully grouted shear wall flange rather than a weighted average based on the number of grouted and hollow cells.
“Shouldn’t the grouted result be the same using the effective f’m value when bars are in every cell?” you may ask, slowly sinking into your chair as you count the minutes you’ve spent here reading this article. Firstly, yes, that would be correct and second, you have ascended into the upper echelon of MASS power user territory and deserve a pat on the back.

Artists depiction of the average MASS user
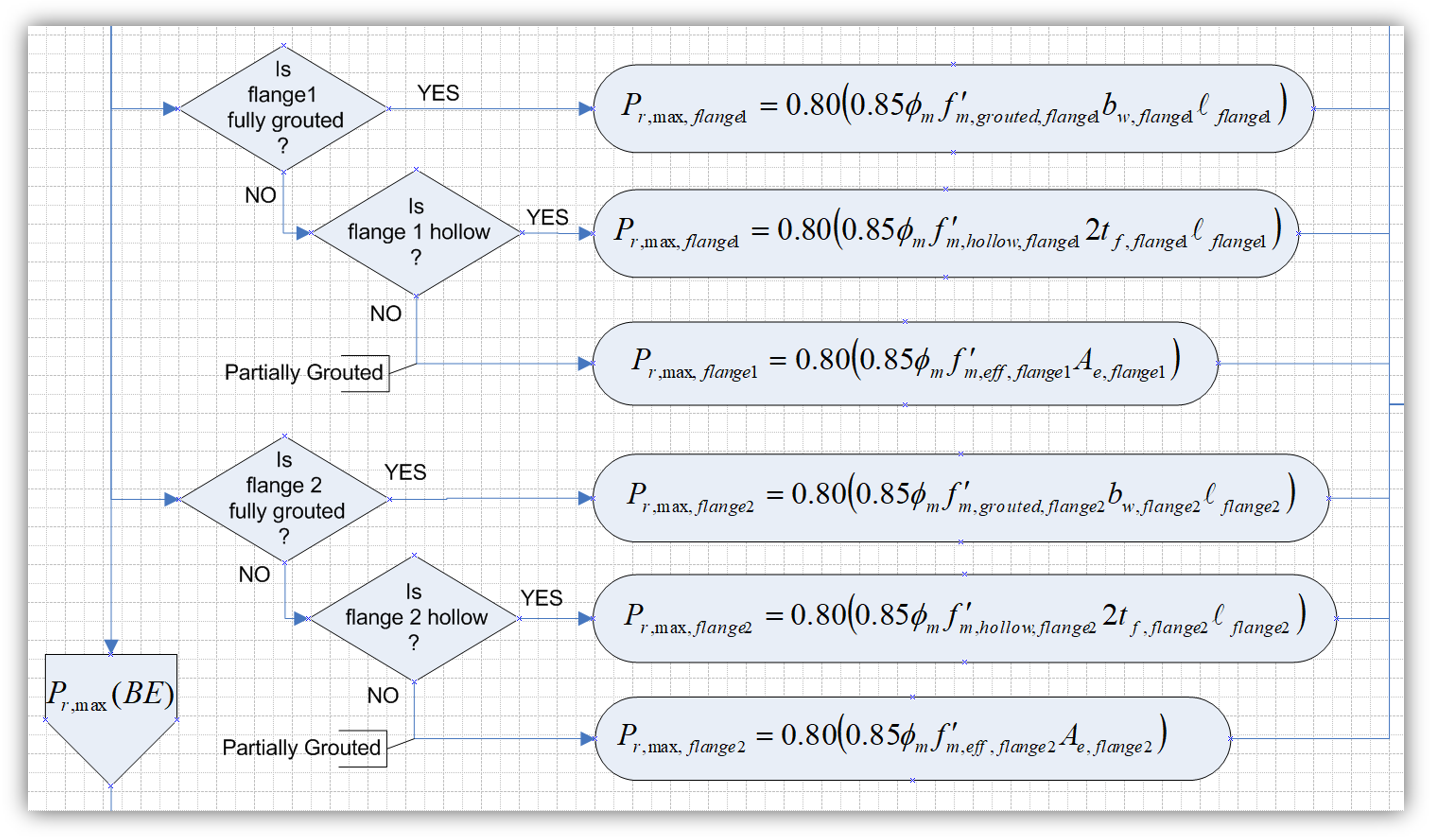
As seen in the earlier flowchart screenshot, the grouting selection is what impacts which process is used but the f’m,eff formula for a wall with no hollow cells should be the same as the formula using f’m,grouted. The bug was triggered by the flange first not being recognized as being “fully grouted’ while also not technically being “partially grouted” which is exactly where the bug was and has since been corrected.
This bug ended up being very simple to find in the code and fix. It has been added to the known bugs page found here and will no longer be present in Versions 4.0 and newer.
Our Response
Bugs of this nature are taken very seriously. It was discovered in-house but not until very late in the Version 4.0 development process. As a result, the bug was investigated and a fix was added to Version 4.0. It has also been posted on our Known Bugs page where it links to this article.
If there is any question regarding the integrity of the results for a specific MASS project file, please feel free to contact CMDC directly. As the authorized MASS technical service provider, CMDC is available to help designers understand the specifics of identifying this issue, as well as any other masonry related technical questions. Click here for more information on technical assistance offered by CMDC.
As always, feel free to contact us if you have any questions at all. CMDC is the authorized service provider for the MASS software which is a joint effort of between CCMPA and CMDC.